
Double-checking NPR's income data
21 Feb 2015
According to NPR.org, “After 1980, only the top 1% saw their incomes rise.” Flowing Data quoted this figure:

You can see the trend more clearly here (note that the y-axis shows growth in year X vs. 1917; so, it’s clear that income growth stagnated for the bottom 90% in the last 40 years):
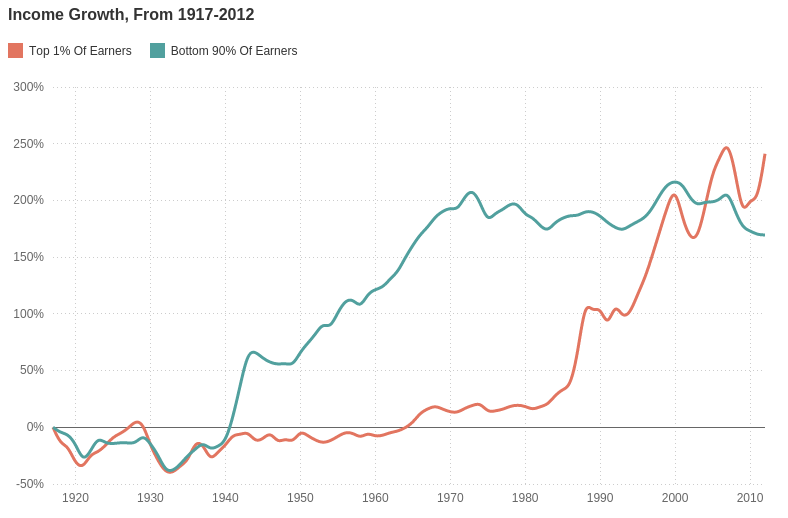
Their data came from World Top Incomes Database.
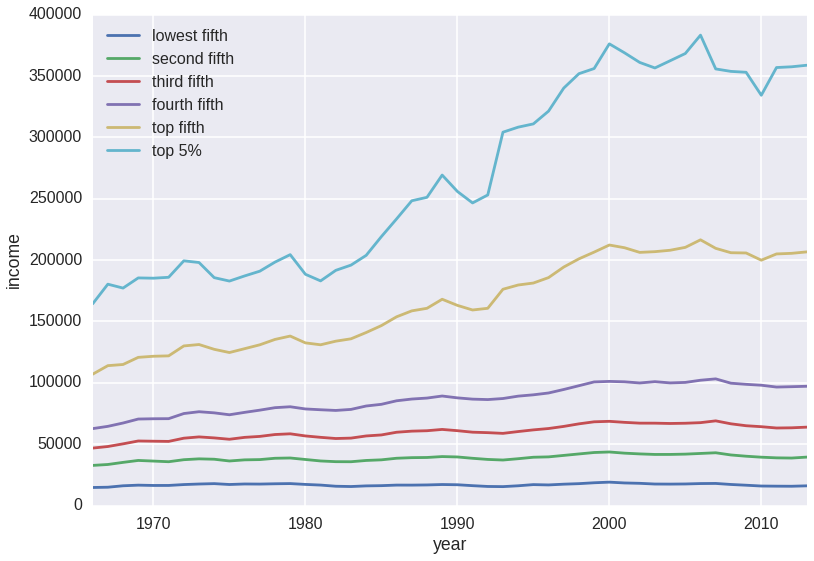
I decided to double-check this claim using a dataset from census.gov
Python code:
%matplotlib inline
import pandas as pd
import seaborn as sns
sns.set(context="poster", style="dark")
import mpld3

# csv location = https://github.com/aflyax/Python/blob/master/income/income_2013_dollars.csv
income_df = pd.read_csv("income_2013_dollars.csv", sep='\t', thousands=',')
income_df.columns = ["year", "lowest fifth", "second fifth", "third fifth", "fourth fifth", "top fifth", "top 5%"]
income_df.sort(columns="year", inplace=True)
income_df.head()
| year | lowest fifth | second fifth | third fifth | fourth fifth | top fifth | top 5% | |
|---|---|---|---|---|---|---|---|
| 47 | 1966 | 14747 | 32739 | 46844 | 62710 | 107026 | 164340 |
| 46 | 1967 | 14977 | 33490 | 48138 | 64560 | 113997 | 180362 |
| 45 | 1968 | 16143 | 35208 | 50300 | 67270 | 114947 | 177194 |
| 44 | 1969 | 16656 | 36783 | 52635 | 70510 | 120757 | 185476 |
| 43 | 1970 | 16404 | 36271 | 52445 | 70744 | 121652 | 185243 |
income_df.tail()
| year | lowest fifth | second fifth | third fifth | fourth fifth | top fifth | top 5% | |
|---|---|---|---|---|---|---|---|
| 4 | 2009 | 16604 | 40232 | 65061 | 98788 | 205788 | 352985 |
| 3 | 2010 | 15944 | 39436 | 64276 | 98064 | 199918 | 334275 |
| 2 | 2011 | 15828 | 38898 | 63212 | 96563 | 205003 | 356839 |
| 1 | 2012 | 15760 | 38739 | 63372 | 96861 | 205503 | 357458 |
| 0 | 2013 | 16109 | 39514 | 63916 | 97207 | 206687 | 358722 |
ax = income_df.plot(x="year")
ax.set_ylabel("income")
ax.set_xlabel("year")
print("feel free to interact with the graph:")
mpld3.display() # to make interactive graph
income_df[income_df.year.isin([1970, 2000, 2013])]
| year | lowest fifth | second fifth | third fifth | fourth fifth | top fifth | top 5% |
|---|---|---|---|---|---|---|
| 1970 | 16404 | 36271 | 52445 | 70744 | 121652 | 185243 |
| 2000 | 19103 | 43678 | 68646 | 101170 | 212266 | 376138 |
| 2013 | 16109 | 39514 | 63916 | 97207 | 206687 | 358722 |
Conclusion: While it is true that the lowest fifth stagnated since 1970, the second, the third, and the fourth fifths (and, of course, the top fifth) increased their income. (Although all groups, including the top 5%, seem to have stagnated since 2000.)
This is a slightly different story from “after 1980, only the top 1% saw their incomes rise”. (It is also beside the point that neither NPR’s nor the above graph show mobility. I.e., the same person in 1970 and today is unlikely to belong to the same “income class”. These data also do not include any information on immigration or unemployment.)
Notebook for this code is here.