
Create a heatmap of your Google Maps trips
15 Feb 2015
In this post, I am not writing code in Python or Julia (even though it was inspired by these instructions that use Python code). I will show how to use online JavaScript-based tool to plot your Google Maps locations in a heatmap form. You can use it even if you don’t know how to code at all.
It is called Location History Visualizer; the instructions are on the page once you open it. You can either use:
- Google Takeout to download your Google Maps location history (uncheck the other boxes), or:
- Google Location History KML API endpoint (much faster but still a bit experimental) — the file downloads automatically
After obtaining either file, just drag it onto the Visualizer page.
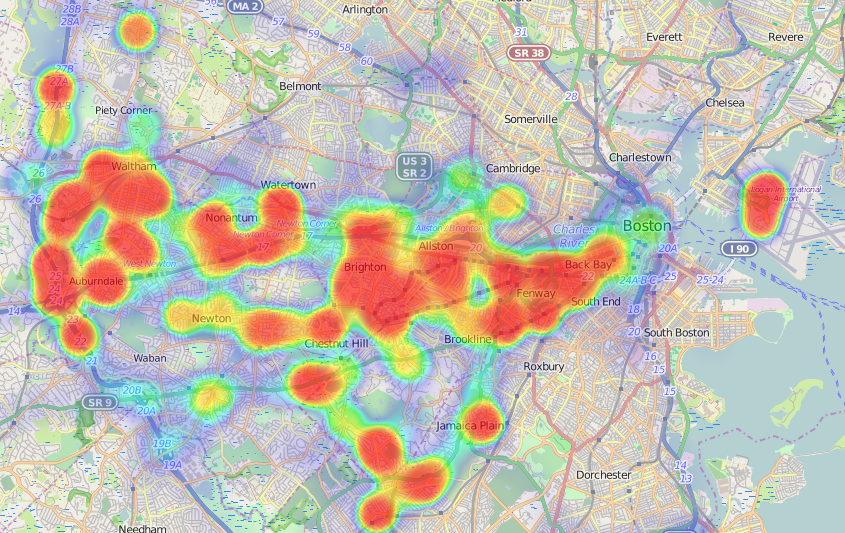
The heatmap of your travels (as recorded through Google Maps history) will be displayed. I have no spatial orientation at all, so I use GPS on my phone to go to a local grocery store. Therefore, I have a lot of Google Maps data.
Boston:
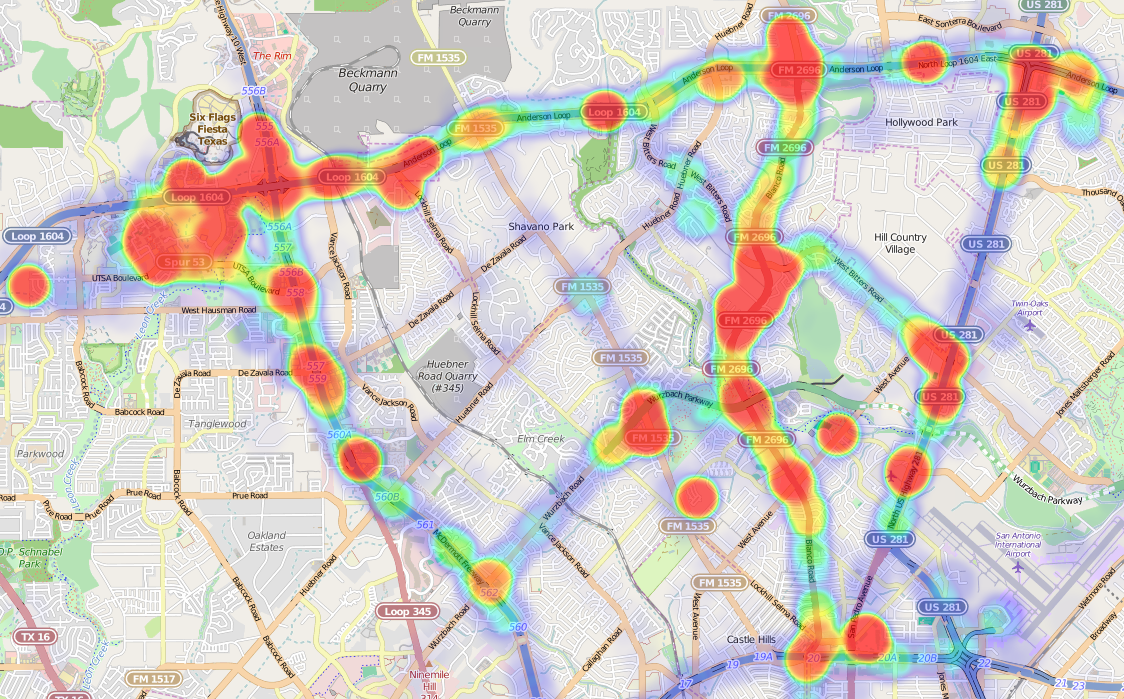
San Antonio:
It also shows my recent trip from Texas to Chicago:
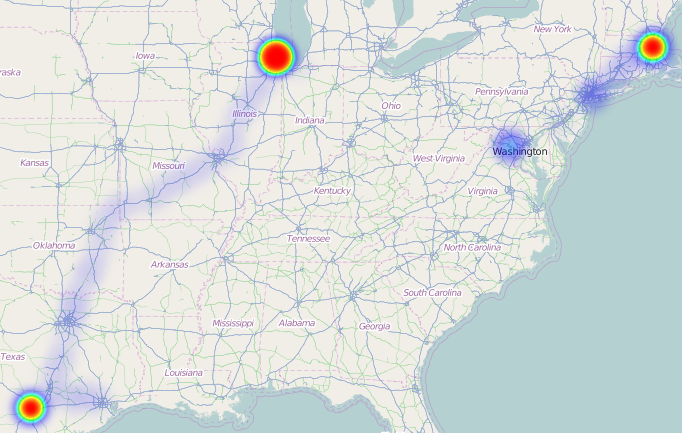
The controls are on the left bottom. I think this example shows that JS is still the king of data visualization.