
How unlikely is the recent Boston snowfall history?
16 Feb 2015
This morning, a discussion on Facebook:
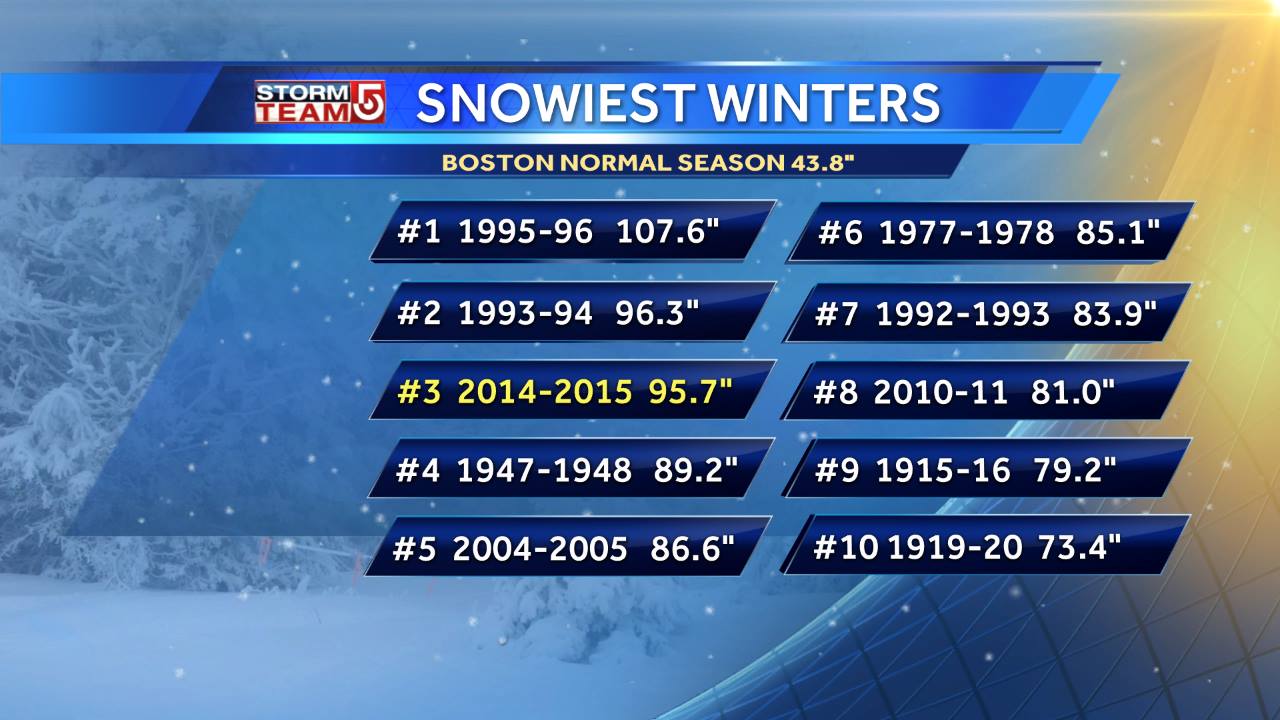
JC: Do you notice how 6 out of the 10 snowiest Boston winters are from the past 25 years? This might be a symptom of climate change.
AF: Your intuition is that if high snowfalls are randomly distributed, it’s unlikely that 6/10 highest would be concentrated in the last 25 out of 115 years. I ask: how unlikely?
Rather than calculating the probability a priori, I decided to run a little Monte Carlo simulation. I am asking how likely it is for 6 out of 10 highest snowfalls to fall within the last 25 years out of 115. I run 1000 trials, each trial being a set 115 numbers. The number of trials in which 6/10 highest numbers are among the last 25 in the set is the datapoint for that run. Then I perform 1000 runs and calculate the converging average of “positive” trials per 1000.
Julia code:
using Gadfly
set_default_plot_size(28cm, 15cm)

# generate random snowfalls

function pop_falls(num_years, highest_fall)
    return [1:num_years], rand(num_years) * highest_fall
end

# test sorting
yrs, falls = pop_falls(115, 110) # populate a vector of snowfalls
sort_ix = sortperm(falls, rev=true) # create indexes of snowfalls, sorted in reverse order (high → low)
println("highest snowfalls:")
println("year \t snowfall")
println([ int(sort_ix[1:10]+1899) falls[sort_ix][1:10] ]) # print years and falls corresponding to the top ten indexes
Out:
highest snowfalls:
` year snowfall `
` 2012 109.4016132516937 `
` 1919 107.44117383081581 <br>
1941 105.39526917324598 <br>
2001 103.54726736791571 <br>
1931 103.53453176618774 <br>
1937 103.00977152759128 <br>
1955 101.88118582663685 <br>
2005 101.71030049090623 <br>
1904 101.44373912780662 <br>
1946 101.13512071149832]`
Coming from Matlab background, I love that I can do the above sorting very concisely in Julia. Now let’s plot a sample set:
yrs, falls = pop_falls(115, 110) # populate a vector of snowfalls
sort_ix = sortperm(falls, rev=true) # create indexes of snowfalls, sorted in reverse order (high → low)

# plotting stuff

set_default_plot_size(28cm, 15cm)

# layer for plotting all points:
all_p = layer(x=yrs, y=falls, Geom.line(), Geom.point(), Theme(default_color=color("#BCBCBC")))

#layer for plotting the maximum 10 points
max_p = plot(x=sort_ix[1:10], y=falls[sort_ix][1:10], Geom.point(), Theme(default_color=color("indianred")),
            Scale.y_continuous(minvalue=0, maxvalue=120),
            Scale.x_continuous(minvalue=0, maxvalue=120),
            Guide.ylabel("snowfall"), # label for y-axis
            Guide.xlabel("year"),  # label for x-axis
            Guide.title("simulated snowfalls: red = max 10"))  # a title)


recent_line = layer(x=[90, 90], y=[0, 120], Geom.line(), Theme(default_color=color("purple")) )

append!(max_p.layers, all_p)
append!(max_p.layers, recent_line)

display(max_p)
I can’t say that Gadfly is without glitches. The maxvalue bit is not working well (in my hands, setting it to anything but 120 resulted in the actual x-axis maximum defaulting to 150).
Let’s do one trial run:
function find_highs(tot_num; num_years=115, max_fall=110, last_years=25, high_num=10)
    num_highs = zeros(tot_num)
    for i in 1:tot_num
        years, falls = pop_falls(num_years, max_fall)
        sort_ix = sortperm(falls, rev=true)
        num_highs[i] = length(find(years[sort_ix[1:high_num]] .> num_years-last_years))
    end

    return num_highs
end

num_highs = find_highs(10000)
p = plot(x=1:10000, y=num_highs,
    Guide.ylabel("max / last 25 years"), # label for y-axis
    Guide.xlabel("trials"))  # label for x-axis

draw(SVGJS("snowfalls_run.svg", 7.5inch, 3.25inch), p)
display(p)

println("chance of getting at least 6/10 max snowfalls in the last 25 years: ",
    (length(find(num_highs.>=6)) / 10000)*100, " percent")
Out:
chance of getting at least 6/10 max snowfalls in the last 25 years: 0.67 percent
Now let’s do 1000 runs and calculate the converging average (expected to be close to 0.69%):
function find_prob(num_repeats)
    num_highs = find_highs(num_repeats)
    return length(find(num_highs.>=6)) / num_repeats
end

num_trials = 1000
probs = zeros(num_trials)
avg_prob = zeros(num_trials)

for i in 1:num_trials
    probs[i] = find_prob(1000)
    avg_prob[i] = mean(probs[1:i])
end

q = plot(x=[1:num_trials], y=avg_prob*100, Geom.line(), Theme(default_color=color("black")),
    Scale.y_continuous(minvalue=0, maxvalue=0.20),
    Guide.xlabel("trials"), # label for y-axis
    Guide.ylabel("P(6/10 highest snowfalls in last 25/115 years), %"),  # label for x-axis
    Guide.title("Monte Carlo simulation of snowfalls (converging average)"))  # a title))


p = layer(x=[1:num_trials], y=probs*100, Geom.line(), Theme(default_color=color("#BCBCBC")))
# q = layer(x=[1:num_trials], y=avg_prob*100, Geom.line(), Theme(default_color=color("black")))
append!(q.layers, p)

display(q)

println("Final avg prob: ", signif(avg_prob[end]*100, 2), " percent")
Out:
Final avg prob: 0.69 percent`
My friend might be right!