Linguistic geolocating with Twitter and Python
04 Feb 2015

That is a fancy title. What I actually did was try to map incidence of specific words spoken in tweets. For fun, I chose y’all and you guys, expecting to see the southerners in the US y’alling and English-speakers elsewhere youguying.
First, we need to write a script that will save a tweet json to a text file every time someone says our keywords. Then we will extract geolocation data from each tweet, classify the text as containing either y’all or you guys and plot the data. The reason it’s better to obtain streaming tweets is that one can get more information that way. Unfortunately, only a small proportion of tweets (~150 out of 6000 on my first try) have geolocation data; so, if we are limited to 100-500 tweets (from using REST API), that will let us have only a few geo-tagged data points to plot.
Write this in your favorite text editor (Sublime Text for me) and save as twitter_streaming.py (adopted from Introduction to Text Mining using Twitter Streaming API and Python by Adil Moujahid):
To get Twitter API credentials for lines 7–10, go to https://apps.twitter.com (see Step 1 here for full instructions).
If you run your new script…
$ python twitter_streaming.py
… you should see print-outs of text contents of all the tweets containing your search words (specified on line 36). To see the full tweet json, change line 19 to print(data). You should see streaming tweet jsons that look something like:
{"created_at":"Thu Feb 05 01:40:20 +0000 2015","id":563150097173606401,"id_str":"563150097173606401","text":"RT @ShawnMendes: #ALittleTooMuchVideo hope you guys like it ! \nhttps:\/\/t.co\/lLkwboKncD","source":"\u003ca href=\"http:\/\/twitter.com\/download\/android\" rel=\"nofollow\"\u003eTwitter for Android\u003c\/a\u003e","truncated":false,"in_reply_to_status_id":null,"in_reply_to_status_id_str":null,"in_reply_to_user_id":null,"in_reply_to_user_id_str":null,"in_reply_to_screen_name":null,"user":{"id":1347907776,"id_str":"1347907776","name":"kiddd","screen_name":"justinbebsrocks","location":"","url":null,"description":"A girl with fantasy dreams, goals,hopes.Determined and in LOTS of fanbases.i love music and youtube.o2l saved me,& jb. 6\/6 forever and always.~6-30-13~","protected":false,"verified":false,"followers_count":1535,"friends_count":2003,"listed_count":6,"favourites_count":41519,"statuses_count":41114,"created_at":"Fri Apr 12 23:10:40 +0000 2013","utc_offset":null,"time_zone":null,"geo_enabled":true,"lang":"en","contributors_enabled":false,"is_translator":false,"profile_background_color":"ABB8C2","profile_background_image_url":"http:\/\/pbs.twimg.com\/profile_background_images\/549729177717338113\/oi3m7Eff.jpeg","profile_background_image_url_https":"https:\/\/pbs.twimg.com\/profile_background_images\/549729177717338113\/oi3m7Eff.jpeg","profile_background_tile":true,"profile_link_color":"118046","profile_sidebar_border_color":"EEEEEE","profile_sidebar_fill_color":"F6F6F6","profile_text_color":"333333","profile_use_background_image":true,"profile_image_url":"http:\/\/pbs.twimg.com\/profile_images\/549730569282543616\/Y0bHOEJM_normal.jpeg","profile_image_url_https":"https:\/\/pbs.twimg.com\/profile_images\/549730569282543616\/Y0bHOEJM_normal.jpeg","profile_banner_url":"https:\/\/pbs.twimg.com\/profile_banners\/1347907776\/1419901040","default_profile":false,"default_profile_image":false,"following":null,"follow_request_sent":null,"notifications":null},"geo":null,"coordinates":null,"place":null,"contributors":null,"retweeted_status":{"created_at":"Thu Feb 05 00:45:32 +0000 2015","id":563136306004643840,"id_str":"563136306004643840","text":"#ALittleTooMuchVideo hope you guys like it ! \nhttps:\/\/t.co\/lLkwboKncD","source":"\u003ca href=\"http:\/\/twitter.com\" rel=\"nofollow\"\u003eTwitter Web Client\u003c\/a\u003e","truncated":false,"in_reply_to_status_id":null,"in_reply_to_status_id_str":null,"in_reply_to_user_id":null,"in_reply_to_user_id_str":null,"in_reply_to_screen_name":null,"user":{"id":379408088,"id_str":"379408088","name":"Shawn Mendes","screen_name":"ShawnMendes","location":"info@shawnmendesofficial.com","url":null,"description":"Student at Hogwarts school of witchcraft and wizardry.. Debut album #Handwritten April 28th ! Pre-order it now ! http:\/\/smarturl.it\/SMHandwrittenDLX","protected":false,"verified":true,"followers_count":2591283,"friends_count":18835,"listed_count":9847,"favourites_count":2652,"statuses_count":8253,"created_at":"Sat Sep 24 22:29:41 +0000 2011","utc_offset":-14400,"time_zone":"Atlantic Time (Canada)","geo_enabled":true,"lang":"en","contributors_enabled":false,"is_translator":false,"profile_background_color":"000000","profile_background_image_url":"http:\/\/abs.twimg.com\/images\/themes\/theme1\/bg.png","profile_background_image_url_https":"https:\/\/abs.twimg.com\/images\/themes\/theme1\/bg.png","profile_background_tile":false,"profile_link_color":"0084B4","profile_sidebar_border_color":"FFFFFF","profile_sidebar_fill_color":"DDEEF6","profile_text_color":"333333","profile_use_background_image":false,"profile_image_url":"http:\/\/pbs.twimg.com\/profile_images\/526932186642264064\/d_2uB3OD_normal.jpeg","profile_image_url_https":"https:\/\/pbs.twimg.com\/profile_images\/526932186642264064\/d_2uB3OD_normal.jpeg","profile_banner_url":"https:\/\/pbs.twimg.com\/profile_banners\/379408088\/1423084014","default_profile":false,"default_profile_image":false,"following":null,"follow_request_sent":null,"notifications":null},"geo":null,"coordinates":null,"place":null,"contributors":null,"retweet_count":3985,"favorite_count":7181,"entities":{"hashtags":[{"text":"ALittleTooMuchVideo","indices":[0,20]}],"trends":[],"urls":[{"url":"https:\/\/t.co\/lLkwboKncD","expanded_url":"https:\/\/www.youtube.com\/watch?v=tnrJL-FSkVo","display_url":"youtube.com\/watch?v=tnrJL-\u2026","indices":[46,69]}],"user_mentions":[],"symbols":[]},"favorited":false,"retweeted":false,"possibly_sensitive":false,"filter_level":"low","lang":"en"},"retweet_count":0,"favorite_count":0,"entities":{"hashtags":[{"text":"ALittleTooMuchVideo","indices":[17,37]}],"trends":[],"urls":[{"url":"https:\/\/t.co\/lLkwboKncD","expanded_url":"https:\/\/www.youtube.com\/watch?v=tnrJL-FSkVo","display_url":"youtube.com\/watch?v=tnrJL-\u2026","indices":[63,86]}],"user_mentions":[{"screen_name":"ShawnMendes","name":"Shawn Mendes","id":379408088,"id_str":"379408088","indices":[3,15]}],"symbols":[]},"favorited":false,"retweeted":false,"possibly_sensitive":false,"filter_level":"low","lang":"en","timestamp_ms":"1423100420646"}
We are loading this json on line 16 and, if we uncomment lines 17 and 18 (and comment-out lines 19–21), we can check if the json has `‘coordinates’ field, and if it does, we print out the coordinates and text. Run it again now to see only the coordinates and text of the geo-tagged tweets appear (it will be slower now; to speed up, you can change the search words to something more common).
Instead of appearing in our Terminal, we want the tweets to be saved. I chose to save the whole json, not just the text, in case I need to access some other informaton about the tweets later. Leave lines 17 and 19 uncommented and comment out lines 18, 20, and 21.
$ python twitter_streaming.py > yall.txt
Now we are ready to read in and plot our tweets (I am switching to an IPython notebook):
import json
import pandas as pd
import bokeh
from bokeh.plotting import figure, output_notebook, show, legend
output_notebook()
I’ll be using Bokeh to plot. Normally I use matplotlib and seaborn for a quick plot, but in this case I want to be able to interact with a plot (e.g., zoom in to look at the data points more closely).
These functions load the jsons, populate a pandas DataFrame to store the text and coordinates from each tweet, and populate an index column (of Boolean values) for each key:
def load_twitter_data(tweets_data_path):
    tweets_data = []
    tweets_file = open(tweets_data_path, "r")
    for line in tweets_file:
        try:
            tweet = json.loads(line)
            tweets_data.append(tweet)
        except:
            continue
    return tweets_data

def pop_tweets(path):
    tweets_data = load_twitter_data(path)
    tweets = pd.DataFrame()

    tweets['text'] = list(map(lambda tweet: tweet['text'], tweets_data))
    tweets['latt'] = list(map(lambda tweet: tweet['coordinates']['coordinates'][0]
                        if tweet['coordinates'] != None else NaN, tweets_data))
    tweets['long'] = list(map(lambda tweet: tweet['coordinates']['coordinates'][1]
                        if tweet['coordinates'] != None else NaN, tweets_data))

    return tweets[tweets.latt.notnull()]

def pop_keys(geo_tweets, keys):
    geo_tweets['text'] = geo_tweets.text.str.lower()
    for key in keys:
        geo_tweets[key] = list(map(lambda words: key in words, geo_tweets.text.values))

    return geo_tweets
I don’t really need to check for the presence of 'coordinates' in pop_tweets(), but I included that anyway, in case you might want to save all the streaming tweets initially, not just the geo-tagged ones.
Now you can load the tweets, even as your python script is saving more of them into your text file (the second two lines are in case you split your text files into several — e.g., if you were running the script, then wanted to interrupt, but didn’t want to override the initial file):
geo_tweets = pop_keys(pop_tweets('yall.txt'), ["y'all", "yall", "you guys"])
yall_tweets = pop_keys(pop_tweets('yall_5.txt'), ["y'all", "yall", "you guys"])
geo_tweets = pd.concat([geo_tweets, yall_tweets], ignore_index=True)

print('total geo_tweets:', len(geo_tweets))
print("y'alls:", len(geo_tweets[geo_tweets["y'all"]]))
Now let’s plot!
f = figure(plot_width=1200, plot_height=900,)

f.scatter(geo_tweets[geo_tweets["y'all"]].latt, geo_tweets[geo_tweets["y'all"]].long, color="indianred", legend="y'all")
f.scatter(geo_tweets[geo_tweets["yall"]].latt, geo_tweets[geo_tweets["yall"]].long, color="indianred")
f.scatter(geo_tweets[geo_tweets["you guys"]].latt, geo_tweets[geo_tweets["you guys"]].long, color="blue",
          legend='you guys')

# stylistic stuff:

f.grid.grid_line_color = None
f.xaxis.axis_line_color = None

f.yaxis.axis_line_color = None
f.yaxis.major_tick_line_color = None
f.axis.major_label_standoff = 0

show(f)
Results:
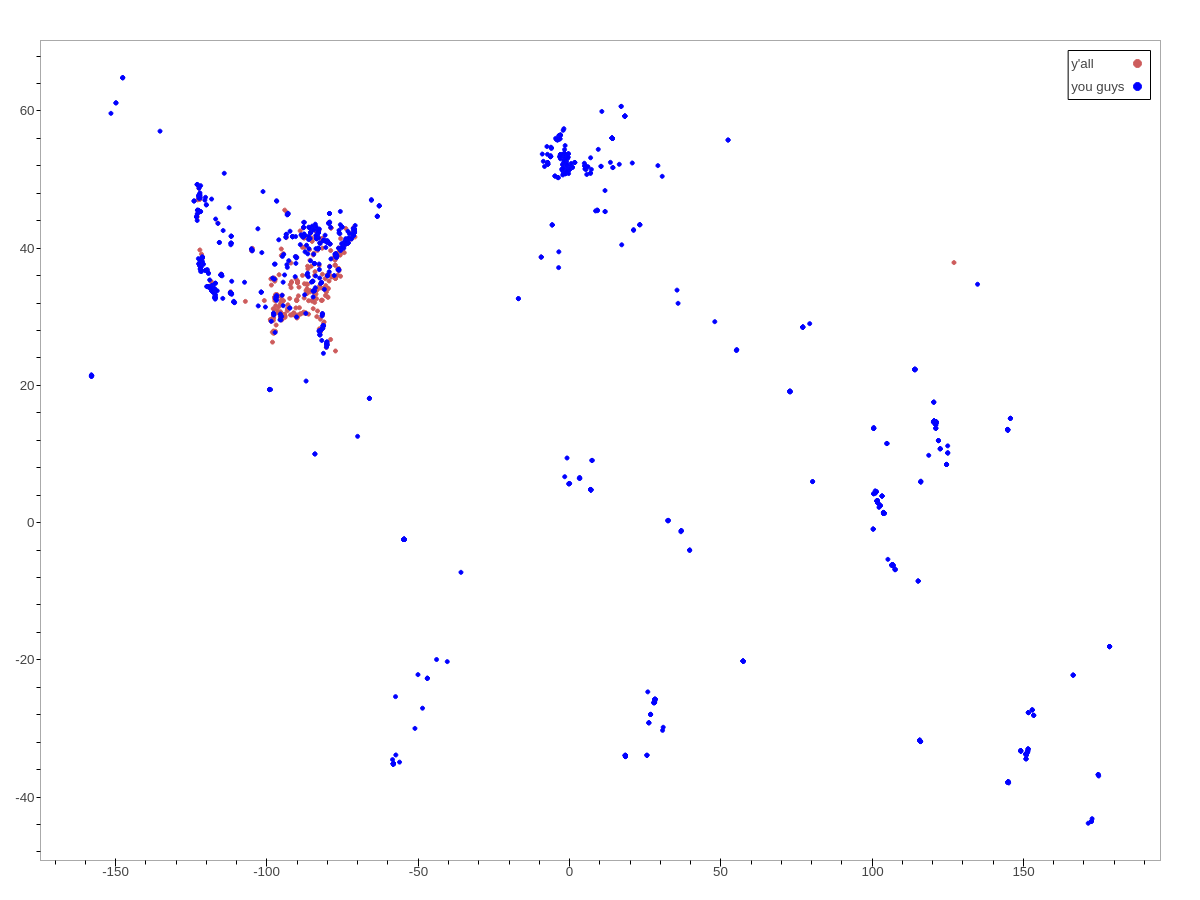
You can see that the y’alls are concentrated in the Deep South (extending as well along the East Coast), and the you guys appear in the North, on the East and West Coasts and elsewhere in the world (the outlines of the British Isles are cute).
Zoom in on the US:
 (interactive Bokeh plot here)
Next possible steps: 1) plot these on a map, 2) do statistics to see if red and blue dots are statistically separable on the East Coast.